Traffic Parrot is a standalone mock and service virtualization server that is compatible with WireMock stub mappings. If you are coming from WireMock and searching for how to enable verbose logging, change the log level, turn off debug output, or simply find where the logs are, this page is the Traffic Parrot answer.
The key difference to keep in mind: in Traffic Parrot you control logging by editing a
logging configuration file in the install directory and then restarting the server.
There is no --verbose command-line flag — unlike WireMock standalone, Traffic Parrot
does not take a verbosity switch on the launch command. The log level lives in the configuration file.
It also helps to know that Traffic Parrot has two distinct places where it records what happened to a request:
The sections below cover both, starting with the files on disk.
Traffic Parrot writes its log files to a logs folder inside the install directory (the folder you unzipped, the same place that contains start.sh and the configuration files). The default destinations are:
| Location | What it contains |
|---|---|
| logs/trafficparrot.log | The main application log: startup, configuration, errors, and one entry per request received by the virtual service. This is a rolling file (1 MB per file, up to 100 backups), so older entries roll into trafficparrot.log.1, trafficparrot.log.2, and so on. |
| tp.out | Console / boot output captured at the install root when you start Traffic Parrot. Useful for diagnosing problems that occur before logging is fully initialised. |
| logs/http-ui-access/ logs/http-vs-access/ |
Jetty HTTP access logs (one request per line) for the management UI port and the virtual service port respectively. See turning logging down to disable these. |
When you start Traffic Parrot in the foreground with start-foreground.sh, the application log is also surfaced on the console so you can watch it live. When you start it in the background with start.sh, the application log stream is not duplicated to the background process's standard output — read logs/trafficparrot.log directly in that case.
The log level for the files and console is controlled by a single configuration file that ships in the install directory:
trafficparrotserver.log4j.properties
This file sits at the install root (the folder you unzipped) — there is no bin subdirectory. It is a standard log4j 1.x properties file. The shipped default looks like this:
log4j.rootLogger=INFO,file,stdout

# Main rolling log file -> logs/trafficparrot.log (1MB per file, 100 backups)
log4j.appender.file.File=logs/trafficparrot.log

# Console
log4j.appender.stdout.Target=System.out

# HTTP request matching category
log4j.logger.WireMock=INFO

# Quieten noisy third-party libraries
log4j.logger.dorkbox.util.jna=ERROR
log4j.logger.dorkbox.systemTray=ERROR
log4j.logger.org.eclipse.jetty.util.ssl.SslContextFactory=WARN
log4j.logger.org.glassfish.jersey.internal.inject.Providers=ERROR
log4j.logger.io.swagger.v3.parser.OpenAPIV3Parser=ERROR
The first line is the one you change to raise or lower verbosity. The value before the comma is the level
(TRACE, DEBUG, INFO, WARN, ERROR); the names after it are the
appenders (here file and stdout) that the level applies to.
Change the root logger from INFO to DEBUG:
log4j.rootLogger=DEBUG,file,stdoutThen restart Traffic Parrot.
DEBUG turns on a flood of internal Jetty and
HTTP-parser messages — over two thousand lines are written during startup alone, and because the file rolls at
1 MB it cycles quickly. Use DEBUG when you are actively diagnosing a problem, then set it back to
INFO for normal running.
Rather than turning everything up, you can keep the root logger at INFO and raise the level of a single
category. For example, lines such as the third-party suppressors above raise (quieten) specific packages to
WARN or ERROR.
INFO unconditionally. Setting log4j.logger.WireMock=DEBUG on its own does
not add extra HTTP request-matching detail to trafficparrot.log. To see the full picture of why a
request matched or did not match a stub, use the
GUI Request Log near-miss view described below.
This is the most common reason WireMock users go looking for verbose logging: a request returned a
404 / "not matched" response and they want to know which part of the stub didn't line up. In Traffic
Parrot the answer is not in the log file — it is in the GUI Request Log.
For an unmatched HTTP request, logs/trafficparrot.log records that a request arrived and that no stub was configured for it, but it does not contain a field-by-field comparison. A real entry looks like this:
2026-05-31 03:43:00,438 INFO  http-vs-Default-136 Request received:
[0:0:0:0:0:0:0:1] - GET /api/users
Host: [localhost:18281]
Accept: [text/plain]
Matched response definition:
(no response definition configured)
Response:
HTTP/1.1 404
That tells you the request reached Traffic Parrot and no mapping matched it, but not why. For the "why", use the Request Log.
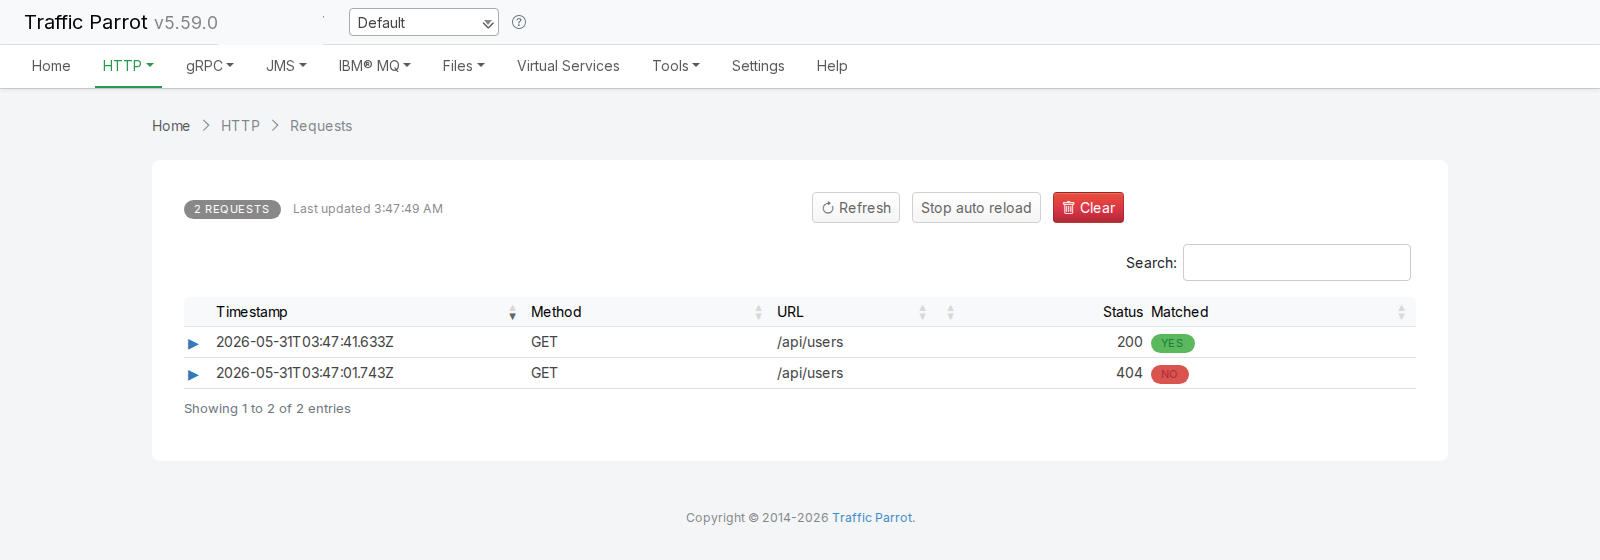
Open the HTTP Request Log from the HTTP dropdown in the top navigation bar (the Requests page). Every request the virtual service has received is listed, with a green Yes badge for matched requests and a red No badge for unmatched ones.
Expand the unmatched (red No) row to reveal the request headers, the response status, and a Near Misses section. Each near miss is a stub that came close to matching, shown as a comparison table with an Expected (stub) column, an Actual (request) column, a match-percentage badge (for example 96% match), and a View Stub link to jump straight to editing that stub. A green tick marks each field that matched; a red cross (and a highlighted row) marks each field that did not.
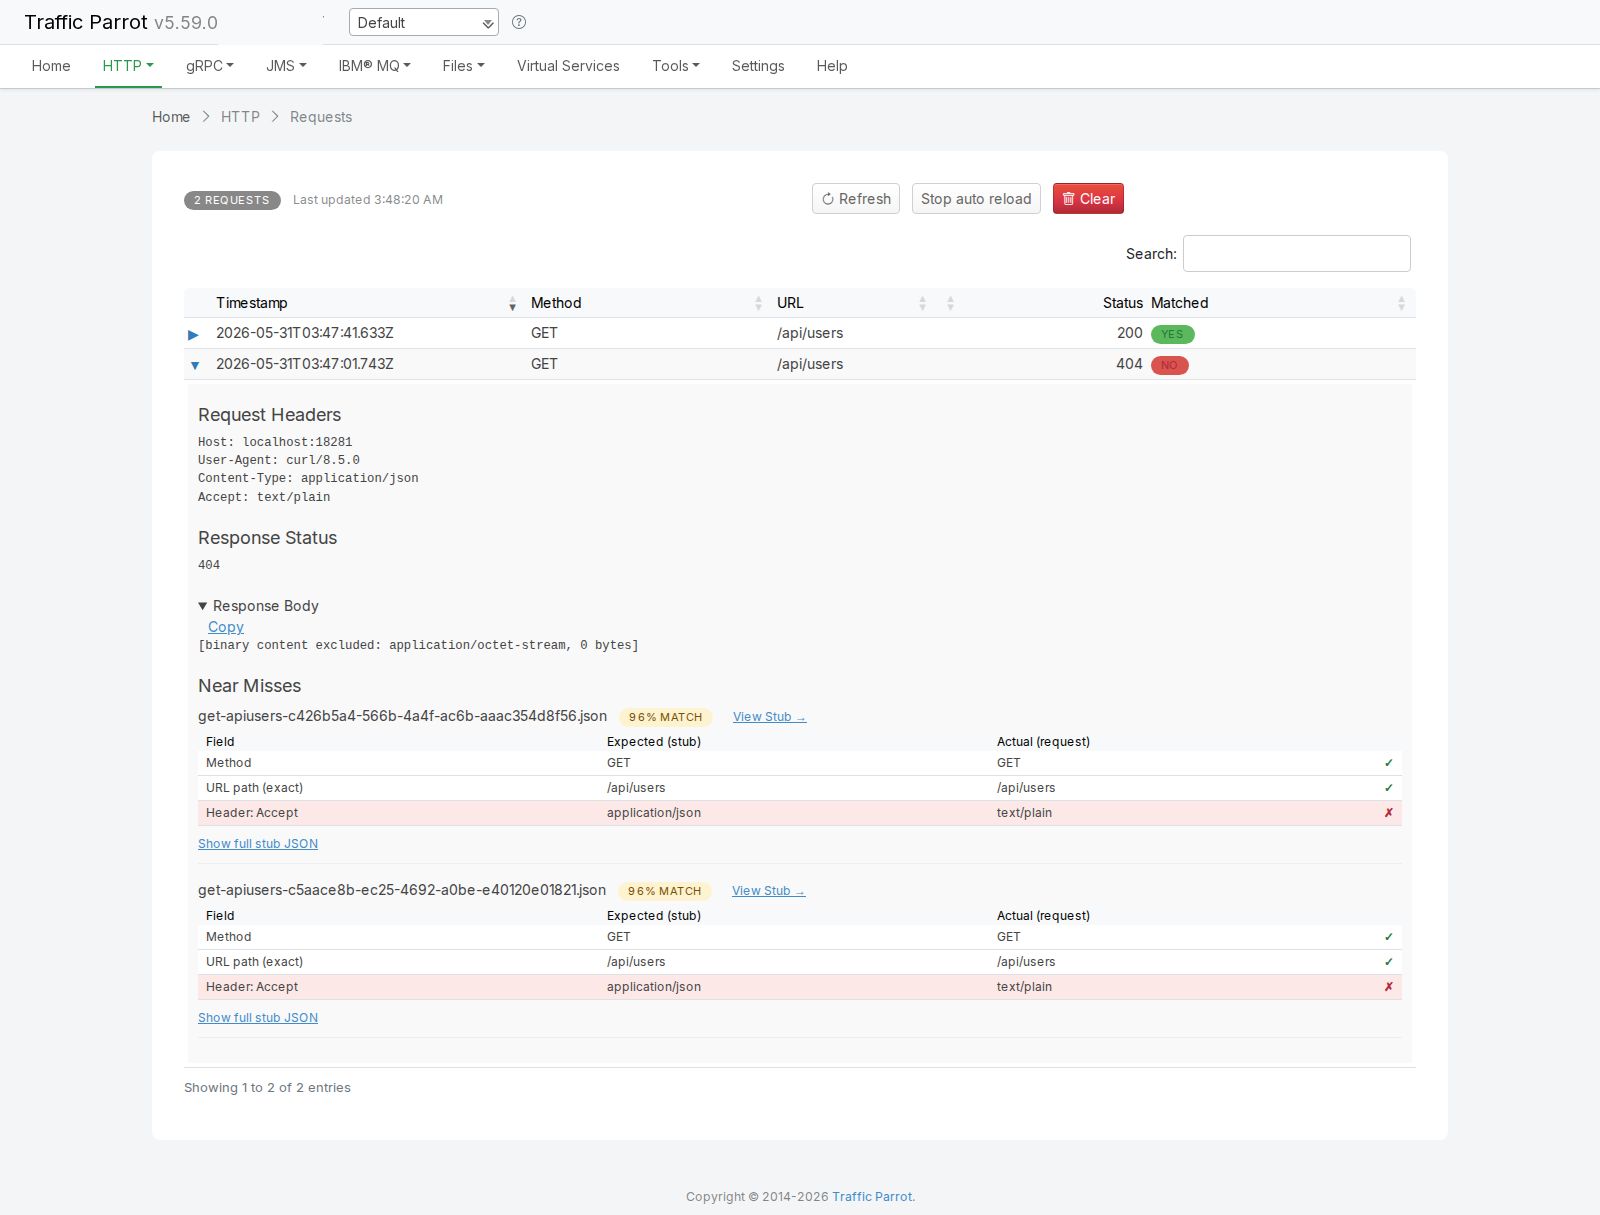
In the example above the stub expects GET /api/users with Accept: application/json, but the
request sent Accept: text/plain. The method and URL path rows match (green ticks); the
Header: Accept row is highlighted with a red cross, making it immediately clear why the request was
not matched. See the HTTP page for the full reference on
near misses for unmatched requests.
If you prefer to read the journal from a script, request the recorded requests through the management API. Each
entry includes a "wasMatched": false flag for unmatched requests and a subEvents entry of
type REQUEST_NOT_MATCHED:
curl http://localhost:8080/__admin/requests
Replace 8080 with your trafficparrot.gui.http.port if you changed it. See the
programmatic setup tutorial for more
management-API examples.
To make Traffic Parrot quieter, do the reverse of enabling verbose logging: raise the level so fewer messages are
written. In trafficparrotserver.log4j.properties, set the root logger (or specific categories) to
WARN or ERROR, then restart:
# Only warnings and errors in the log file
log4j.rootLogger=WARN,file,stdout
Two related settings live in trafficparrot.properties (also at the install root) rather than in the logging file:
| Property | Default | Effect |
|---|---|---|
| trafficparrot.virtualservice.accessLogsEnabled | true |
Set to false to stop writing the Jetty access logs under
logs/http-ui-access/ and logs/http-vs-access/. |
| trafficparrot.virtualservice.httpRequestLoggingDisabled | false |
Set to true to disable capture of the in-memory HTTP request journal that powers the
Request Log (useful for maximum throughput in performance tests). |
Both of these are standard Traffic Parrot properties — see the Configuration Reference for the full list and how to edit trafficparrot.properties.
Traffic Parrot uses the log4j 1.x properties file by default, but it also ships two alternative configuration files at the install root for teams that prefer a different logging framework:
To switch, edit the jvm.args file (also at the install root) and point the -Dtrafficparrotserver.logging.properties.filename= argument at the file you want, then restart. For example:
-Dtrafficparrotserver.logging.properties.filename=trafficparrotserver.logback.xmlMost users do not need to do this; editing the default trafficparrotserver.log4j.properties as shown above is sufficient. See JVM arguments for more about the jvm.args file.